
Multi-Channel Attribution
Multi-Touch Attribution
Introduction
This document serves as an introduction to the estimation of channel attribution via Markov models. This is achieved by mapping out the customer journey, and each step in that journey, that leads to a conversion. After creating the paths, relationships are examined between them to estimate the unique contribution each step has in the conversion path.
An Example
The Data
The data leveraged for the Markov model is customer event data. The event data is tracked by examining clicks or views on paid media to capture an interaction (or touchpoint) with that respective media channel and/or tactic. An example of what event data looks like is below:
| customer_id | channel | tactic | event_type | event_step |
|---|---|---|---|---|
| 1 | Display | Retargeting | View | 1 |
| 1 | Social | Retention | Click | 2 |
| 1 | Display | Retargeting | View | 3 |
| 1 | Search | Retention | Click | 4 |
| 1 | Online | Purchase | 5 |
Customer Paths
The event data is then transformed into a customer path. The path for the above example is shown below:
| Path | Conversion |
|---|---|
| (Start) -> Display -> Social -> Display -> Search -> (Conversion) | 1 |
This would be one of many customer paths to conversion. An example of the path data is shown below:
| Path | Conversions |
|---|---|
| (Start) -> Display -> Social -> Display -> Social -> Search -> Display -> (Conversion) | 1 |
| (Start) -> Display -> Social -> Display -> Search -> (Conversion) | 1 |
| (Start) -> Display -> Search -> (Conversion) | 1 |
| —– | —- |
For each possible step in the path, we can count the number of times that step was taken. An example is below:
| Step | Count |
|---|---|
| (Start) -> Display | 3 |
| (Start) -> Search | 0 |
| (Start) -> Social | 0 |
| Display -> Social | 3 |
| Display -> Search | 0 |
| Display -> (Conversion) | 1 |
| Social -> Display | 2 |
| Social -> Search | 1 |
| Social -> (Conversion) | 0 |
| Search -> Display | 1 |
| Search -> Social | 0 |
| Search -> (Conversion) | 2 |
| ——- | —– |
| Total | 13 |
Transition Probabilities
From the table we can calculate the transition probabilities between the steps:
| Step | Count | Probability |
|---|---|---|
| (Start) -> Display | 3 | 3/3 |
| (Start) -> Search | 0 | 0/3 |
| (Start) -> Social | 0 | 0/3 |
| —— | —- | —- |
| Display -> Social | 3 | 3/4 |
| Display -> Search | 0 | 0/4 |
| Display -> (Conversion) | 1 | 1/4 |
| —— | —- | —- |
| Social -> Display | 2 | 2/3 |
| Social -> Search | 1 | 1/3 |
| Social -> (Conversion) | 0 | 0/3 |
| —— | —- | —- |
| Search -> Display | 1 | 1/3 |
| Search -> Social | 0 | 0/3 |
| Search -> (Conversion) | 2 | 2/3 |
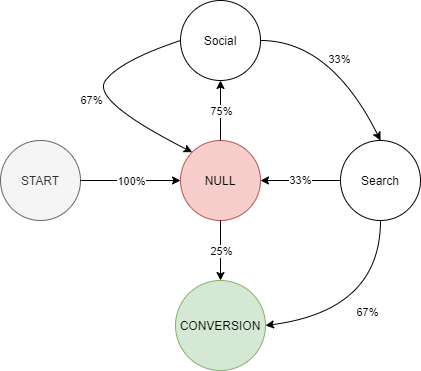
The transition probabilities can be represented graphically, as shown below:
Transition Probabilities
Estimating Attribution
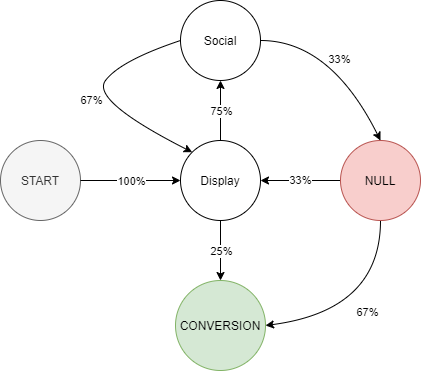
Now that the transition probabilities have been calculated, we need a method to determine the unique impact by each channel. A method to estimate the impact by a channel, is to examine the effects that would occur if that channel were removed. A graphical example is shown below, where the Display channel now becomes NULL.
Display Impact
In this new graph, any arrow that goes into the NULL state, does not move any further. And all arrows coming out of the NULL state are removed. We can see that removing the Display channel, would mean that no customer could get from the START step, to the CONVERSION step. The graph simplifies to the graphic below:
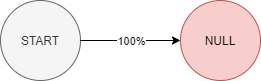
Display Refine
We can see in the graph above, that there is no way to get to the CONVERSION step if Display is removed. So our conversion rate changes from 100% to 0%. This change in conversion rate is how the weighted attribution for a channel is estimated. So in this example, display would receive 100% of it’s original weighting (or 1), since when the channel is removed, we see a 100% change in the conversion rate path.
Another example can be seen with Search. First we place the step in a NULL state:
Search Impact
From there, we can simplify the graph and re-calculate the transition probabilities:
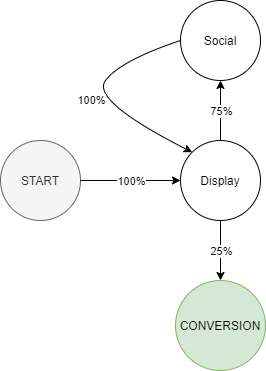
Search Refine
We now see a new calculated 25% conversion rate, when using the revised path. The change in the conversion rate is 75%. So when the search channel is estimated, the impact of that channel is weighted at 75% (or .75).
Differences in Estimation
The Markov model approach differs from other common methods of attribution, such as:
- First touch, where the first step in the conversion path assumes the total attribution weight
- Last touch, where the last step in the conversion path assumes the total attribution weight
- Linear Touch, where all steps in the conversion path are assigned equal weight
- Time Decay, where each step receives a smaller weight the further the step is away from the conversion event.
We leverage the Markov model, as it is an empirically driven method, that is free of the assumptions that the alternative methods above place. For example, a last touch attribution places a large assumption that the last touch-point on the customer path receives all of the importance in the conversion. In contrast, the Markov model estimates the importance in a data driven method where the importance is determined by the probabilities calculated for each step in the conversion path. This also captures the multi-interaction component (multiple channels and/or tactics) of the customer journey, while the last touch attribution captures only one, regardless of the length of the customer journey.
The Markov model is fit within different points of sale (In-Store, Online) and Segments (New, Reactivated, Retained) to provide a unique look at how the customer journeys may vary. The result is an in-depth analysis that allows visibility into the defining charactestics that influence the customer along their conversion journey.
